


Deep Space Network
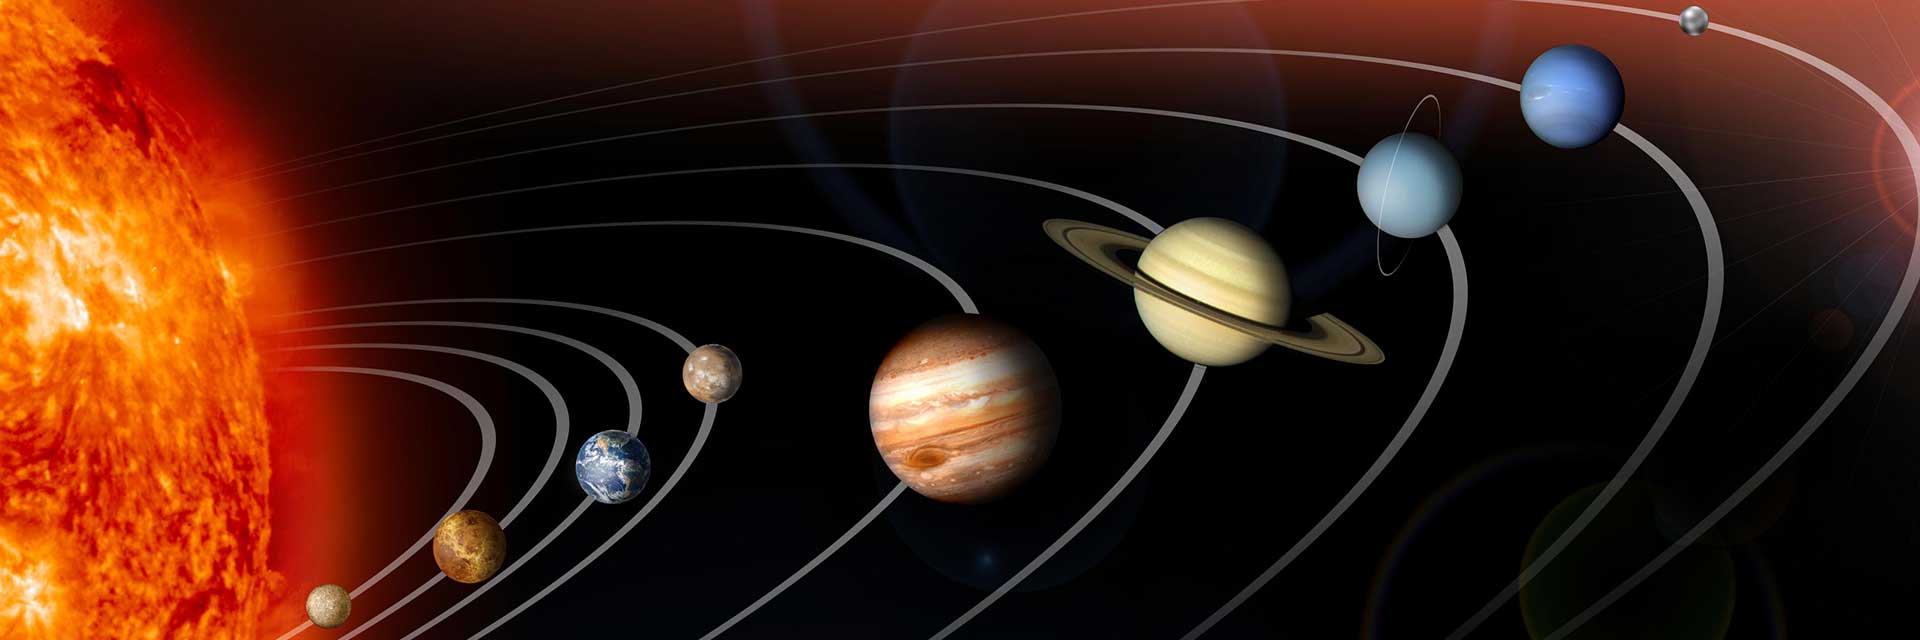
When it comes to making a long-distance call, it’s hard to top NASA’s Deep Space Network. The largest and most sensitive scientific telecommunications system in the world, the antennas of the DSN are our indispensable link to missions venturing beyond Earth. The DSN provides a crucial connection with our spacecraft, receiving never before seen images and scientific information on Earth, propelling our understanding of the universe, our solar system and ultimately, our place within it.
What is the Deep Space Network?
The world’s largest telecommunications system.
The Deep Space Network—or DSN—is NASA’s international array of giant radio antennas that supports interplanetary spacecraft missions, plus a few that orbit Earth. The DSN also provides radar and radio astronomy observations that improve our understanding of the solar system and the larger universe.
Read More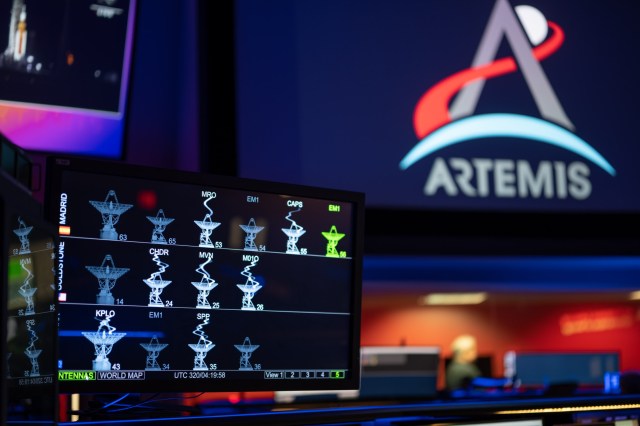
How Does It Work?
Much more than a collection of big antennas.
NASA’s Deep Space Network is a powerful system for commanding, tracking and monitoring the health and safety of spacecraft at many distant planetary locales. The DSN also enables powerful science investigations that probe the nature of asteroids and the interiors of planets and moons.
Read More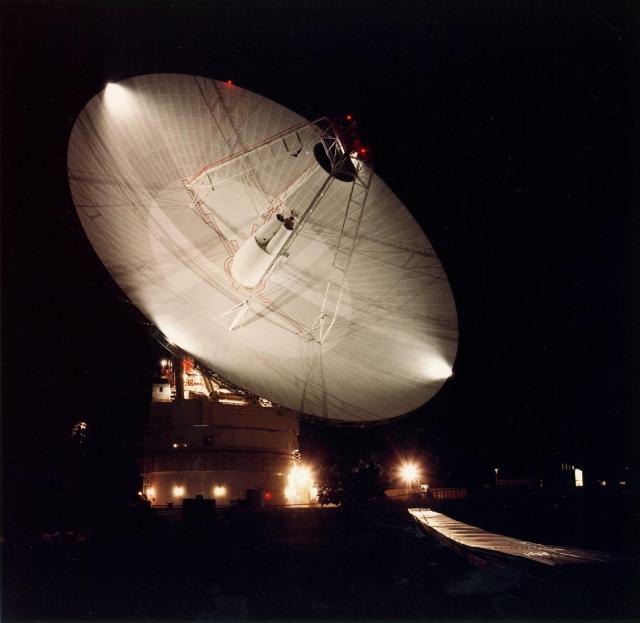
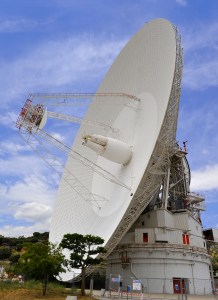
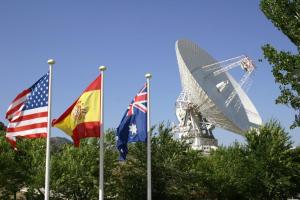
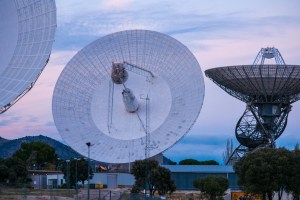
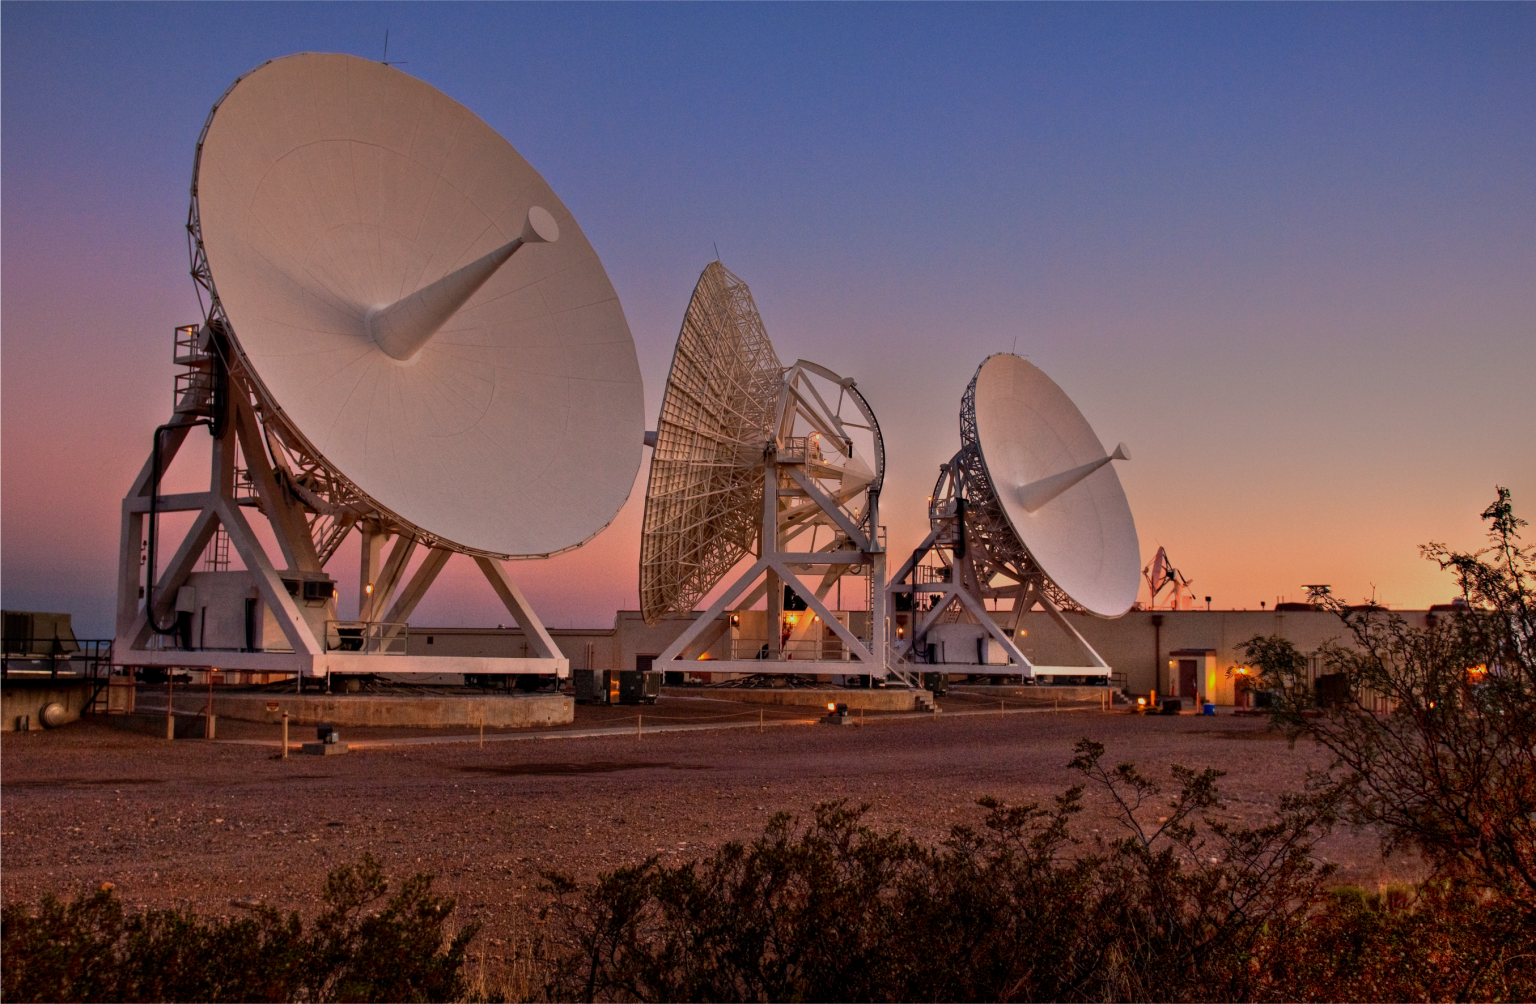
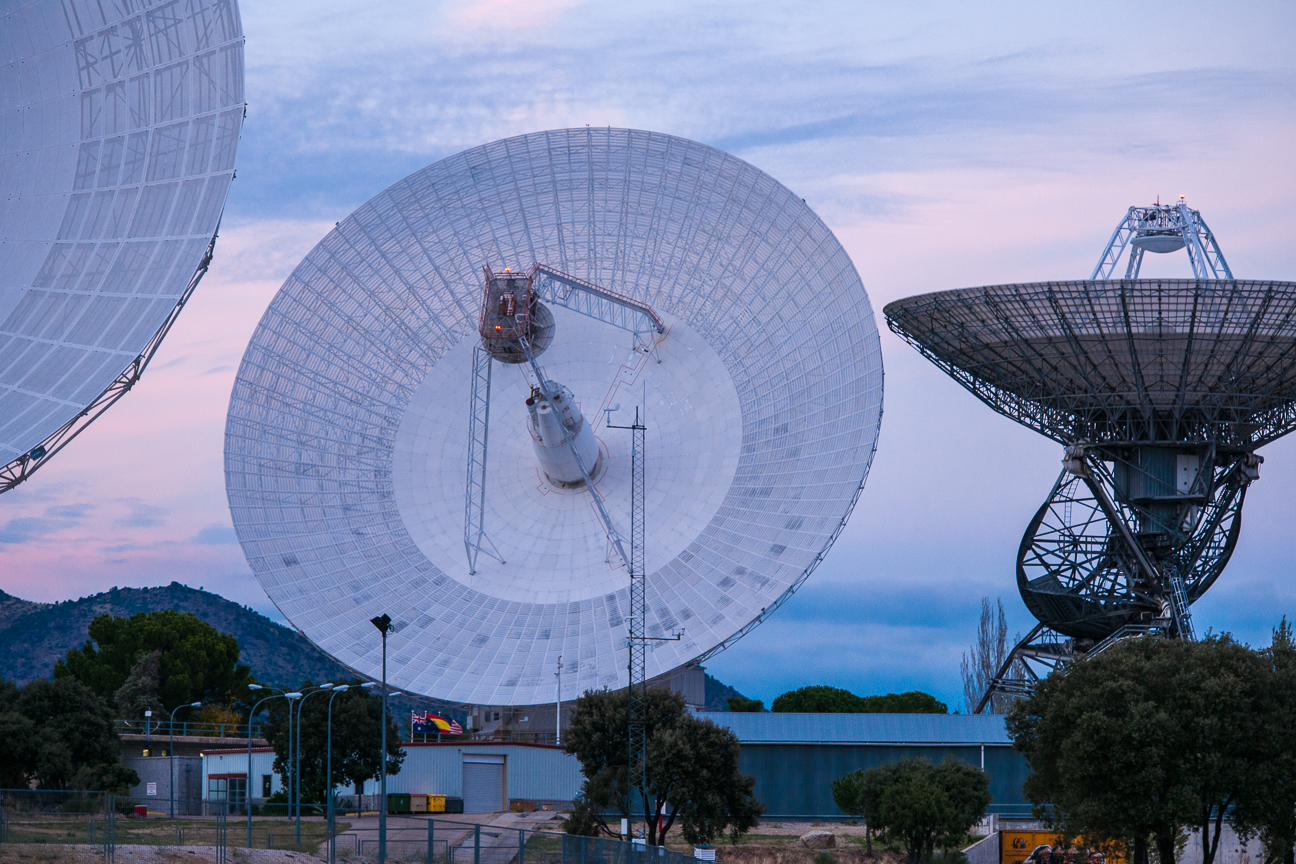
Deep Space Network Complexes
The three facilities are strategically equidistant for full coverage.
The three Deep Space Network complexes are located at Goldstone, near Barstow, California; near Madrid, Spain; and near Canberra, Australia. The strategic placement of these sites permits constant communication with spacecraft as our planet rotates – before a distant spacecraft sinks below the horizon at one DSN site, another site can pick up the signal and carry on communicating.
Read More
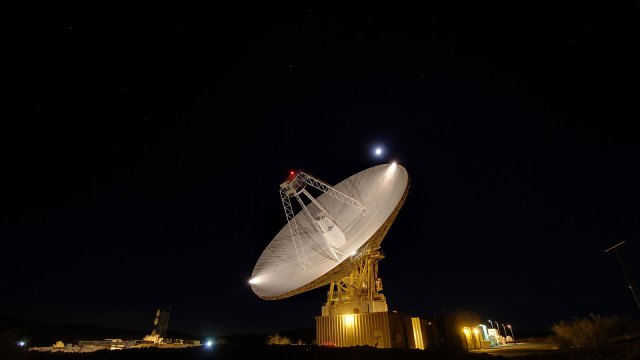
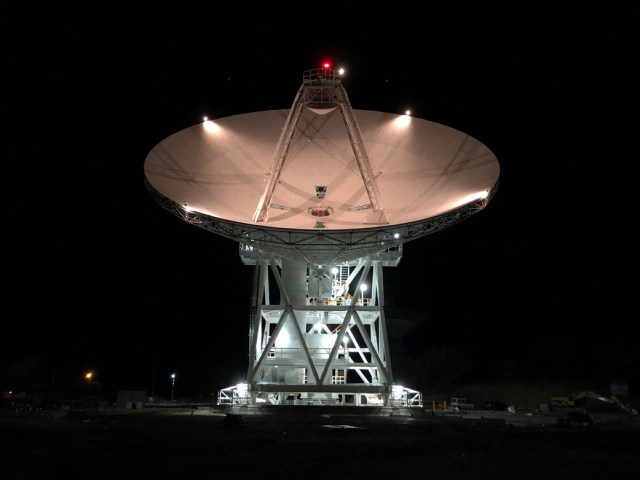
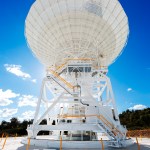
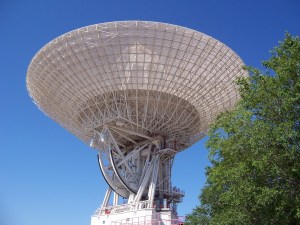
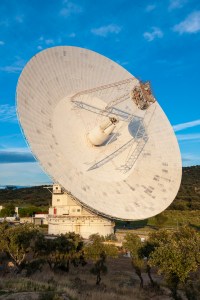
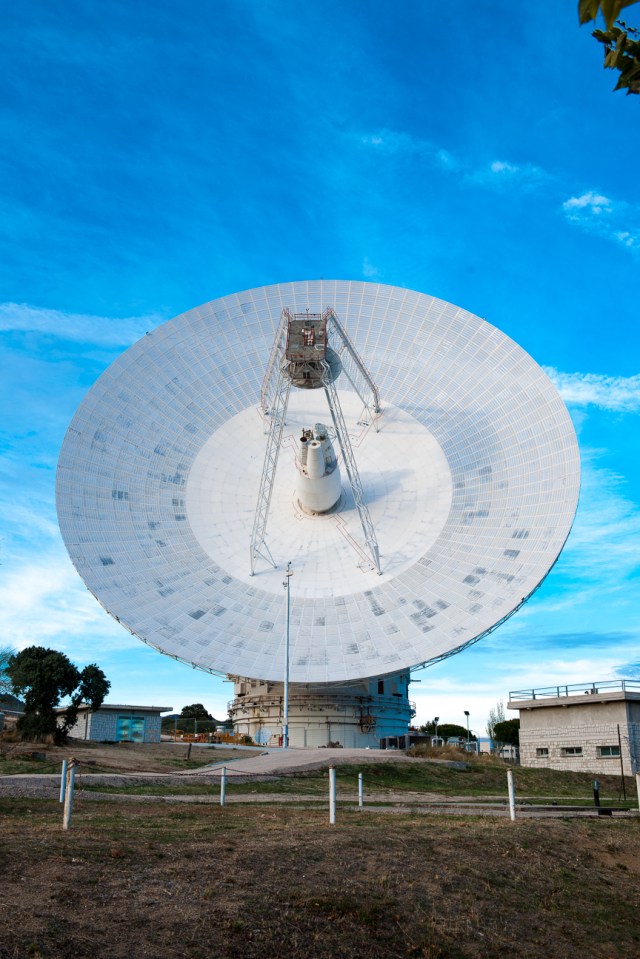
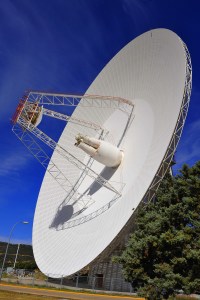
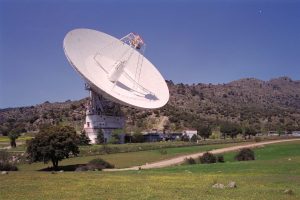
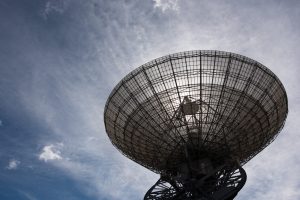
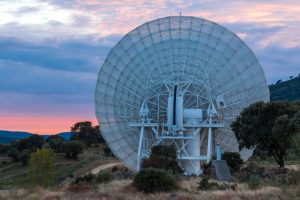
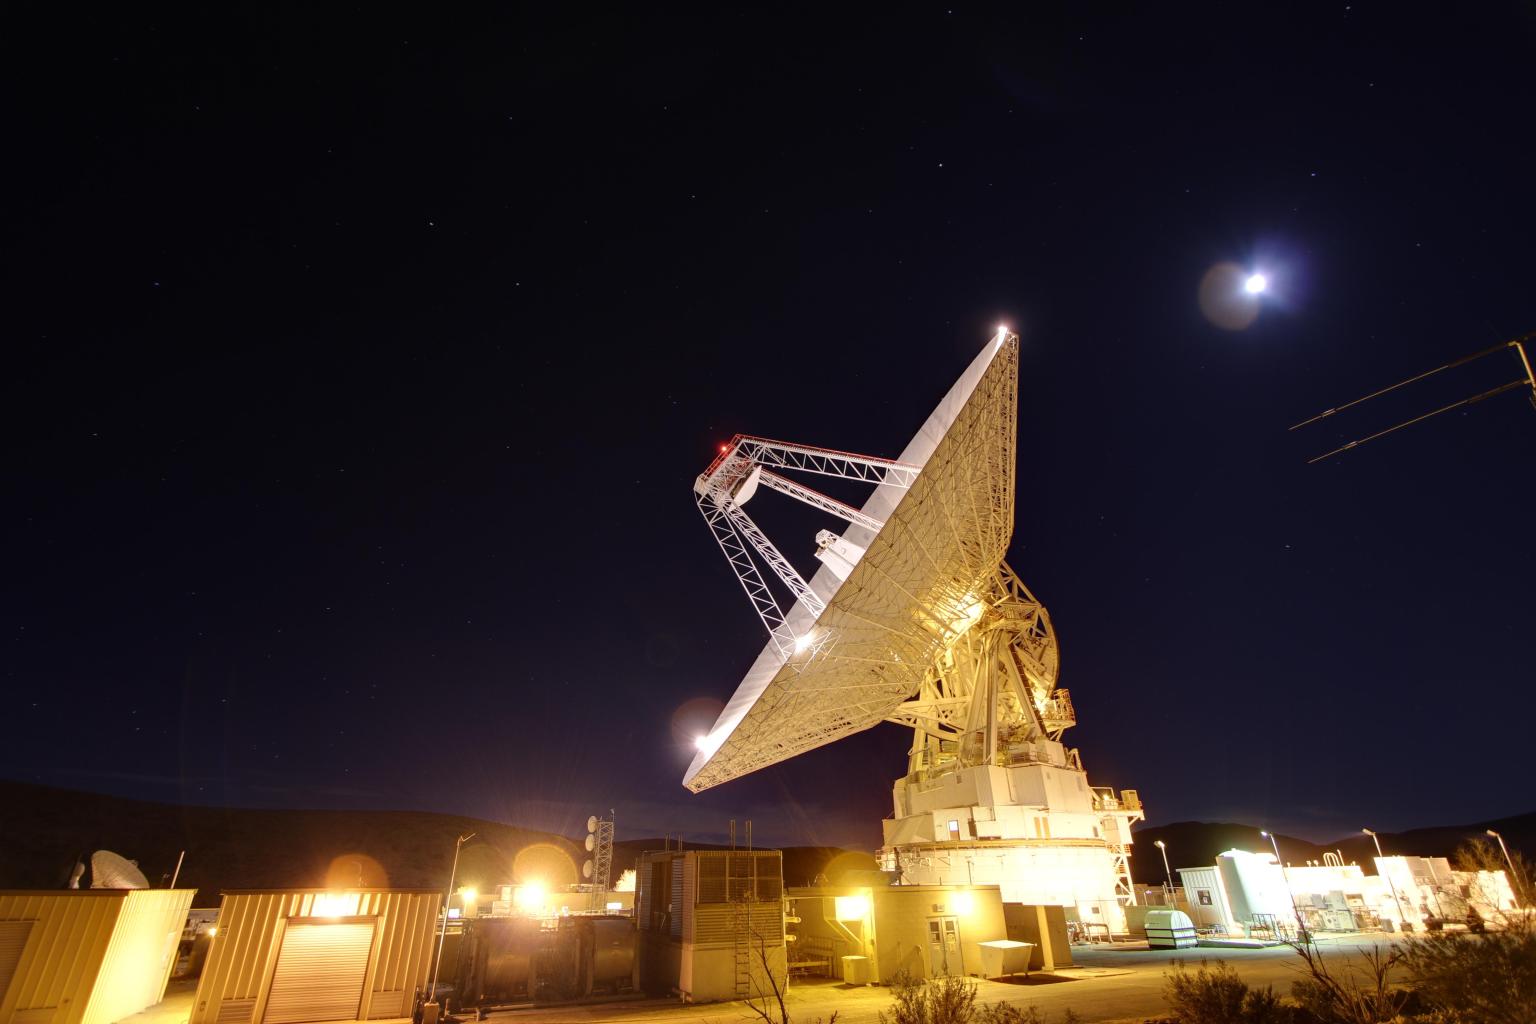
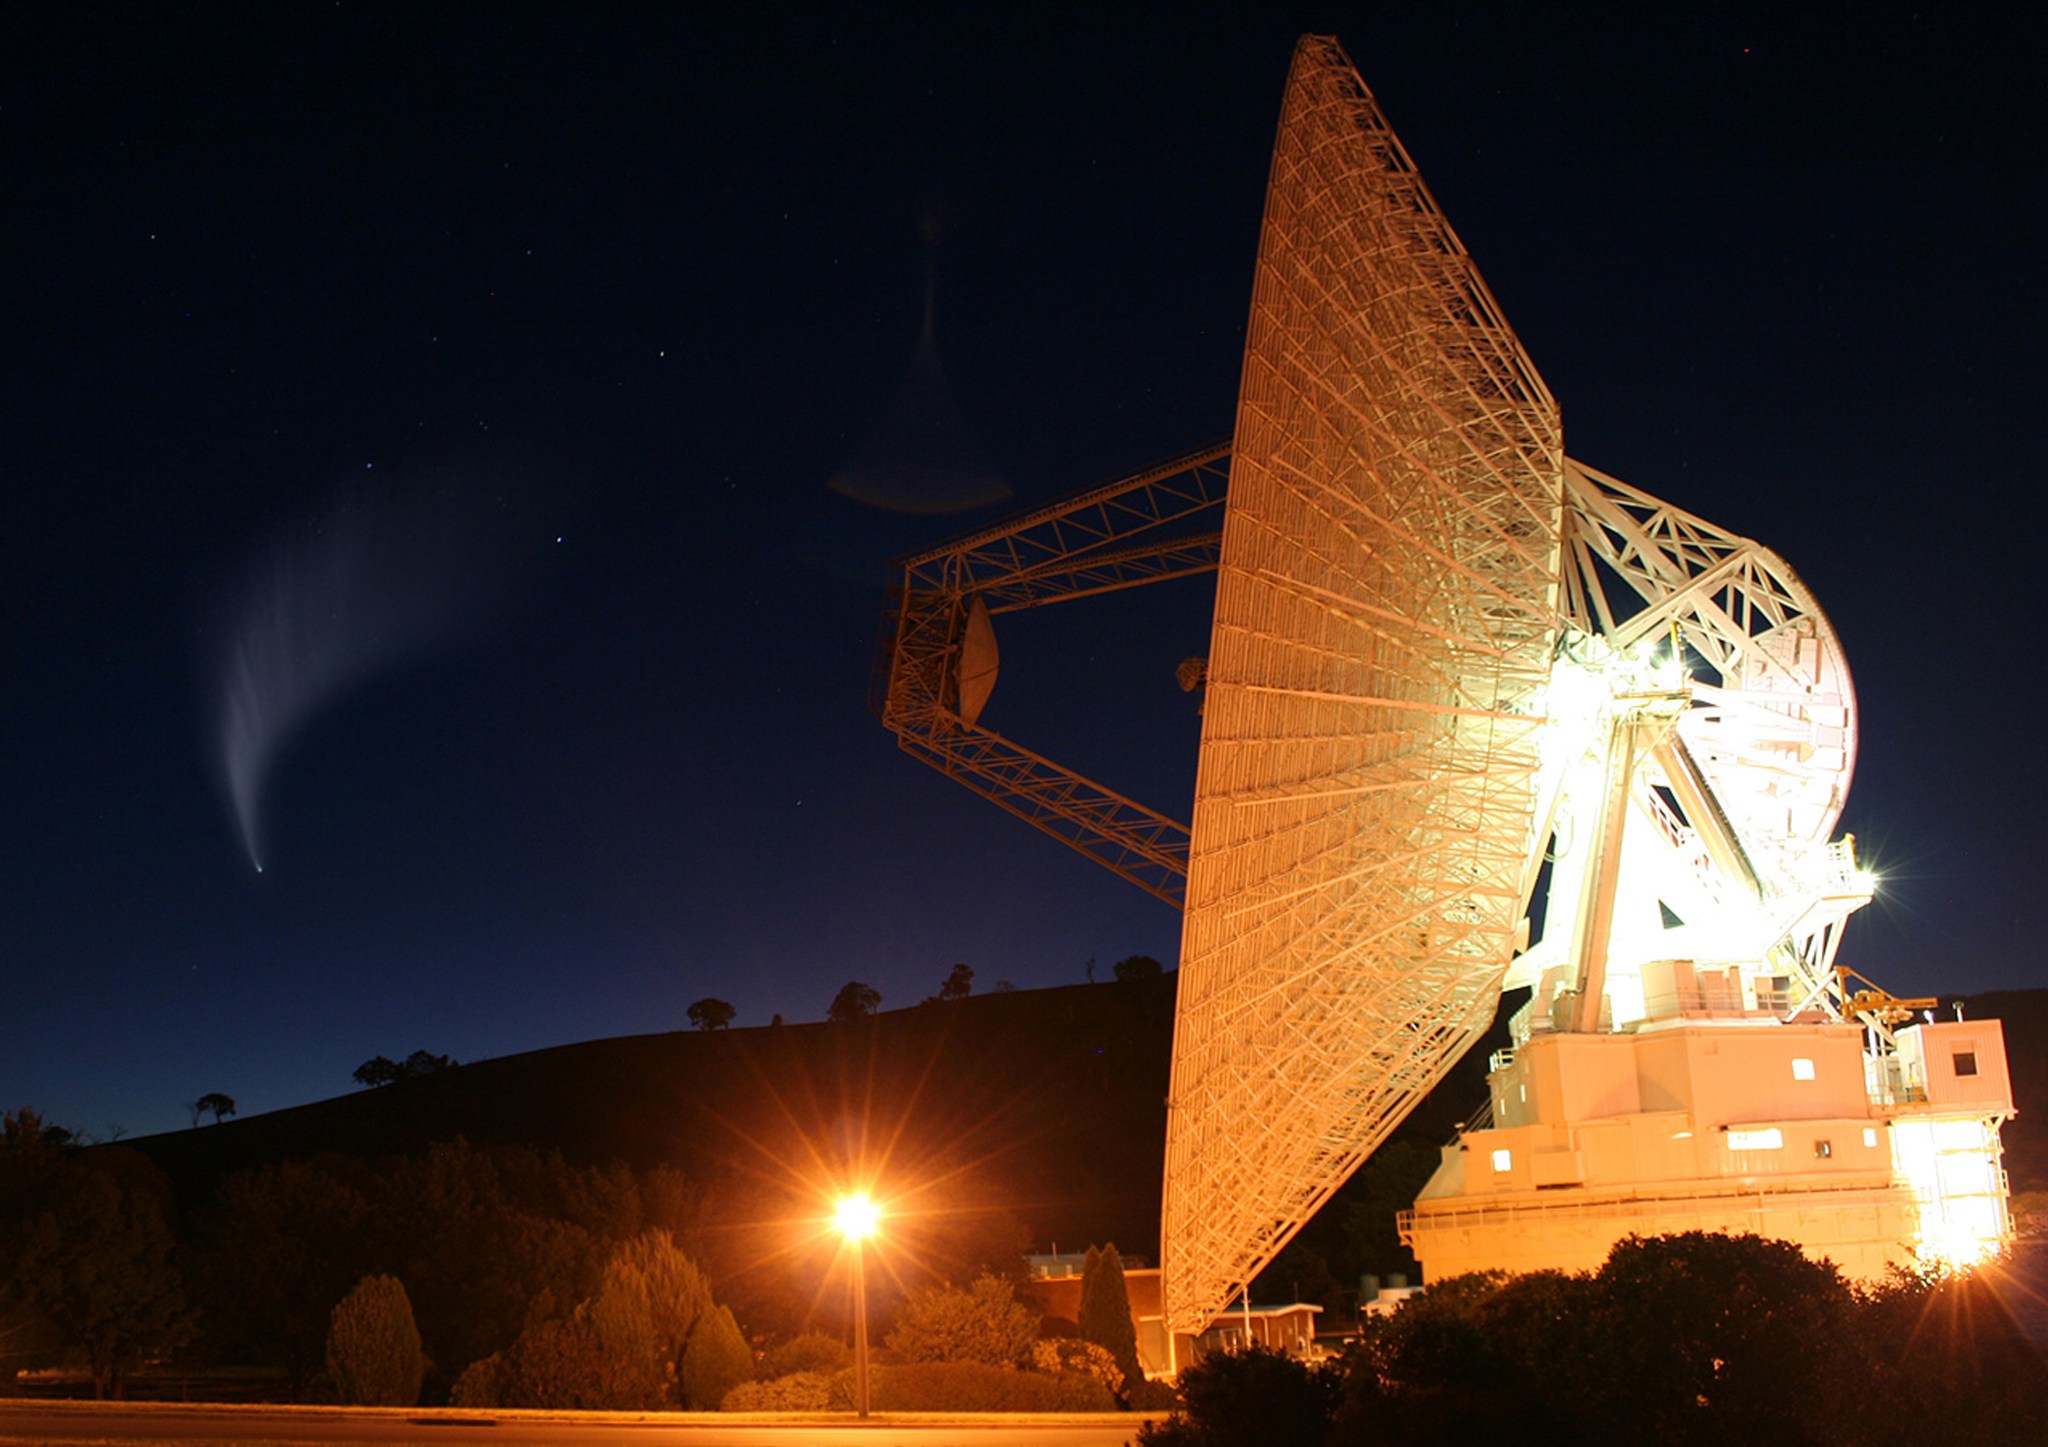
Antennas of the DSN
The largest and most sensitive NASA antennas.
Each Deep Space Network site has one huge, 230-foot (70-meter) diameter antenna, one 85-foot (26-meter) diameter antenna, and multiple 112-foot (34-meter) diameter antennas capable of tracking spacecraft traveling tens of billions of miles from Earth.
Read More
DSN Now
The current state of the Deep Space network
DSN Now is driven by real-time data provided by the ground stations of the Deep Space Network and is updated every 5 seconds. It is not referencing a schedule of planned communication sessions.
DSN Services
24 hours a day, seven days a week, 365 days per year.
The DSN provides communications services to a wide array of customers to include: deep space missions, lunar missions, relay operations at Mars, Lagrange point missions, and missions in a Highly Elliptical Orbit (HEO).
Read More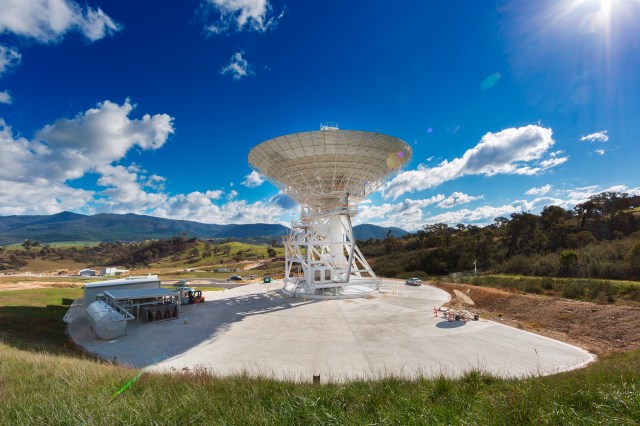
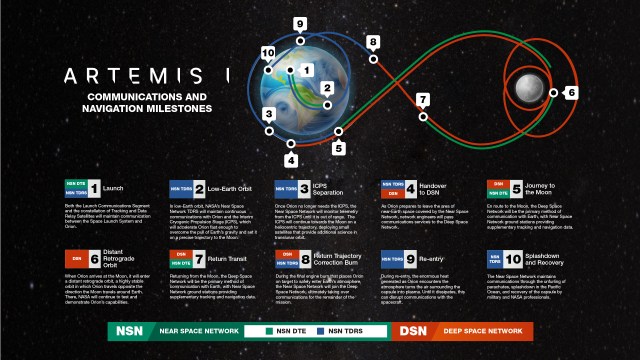
How NASA’s Deep Space Network Supports the Agency’s Missions
The DSN will enable NASA to track and communicate with Artemis I while working to provide coverage across dozens of…
Read the Story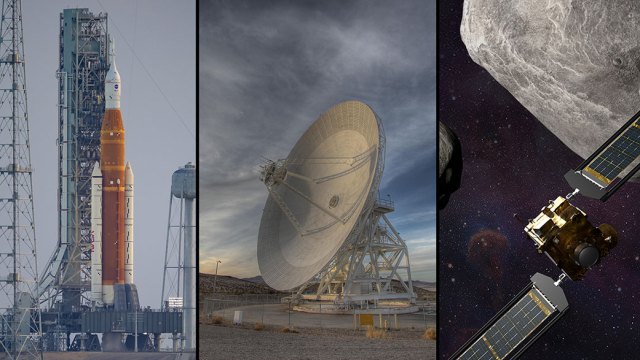
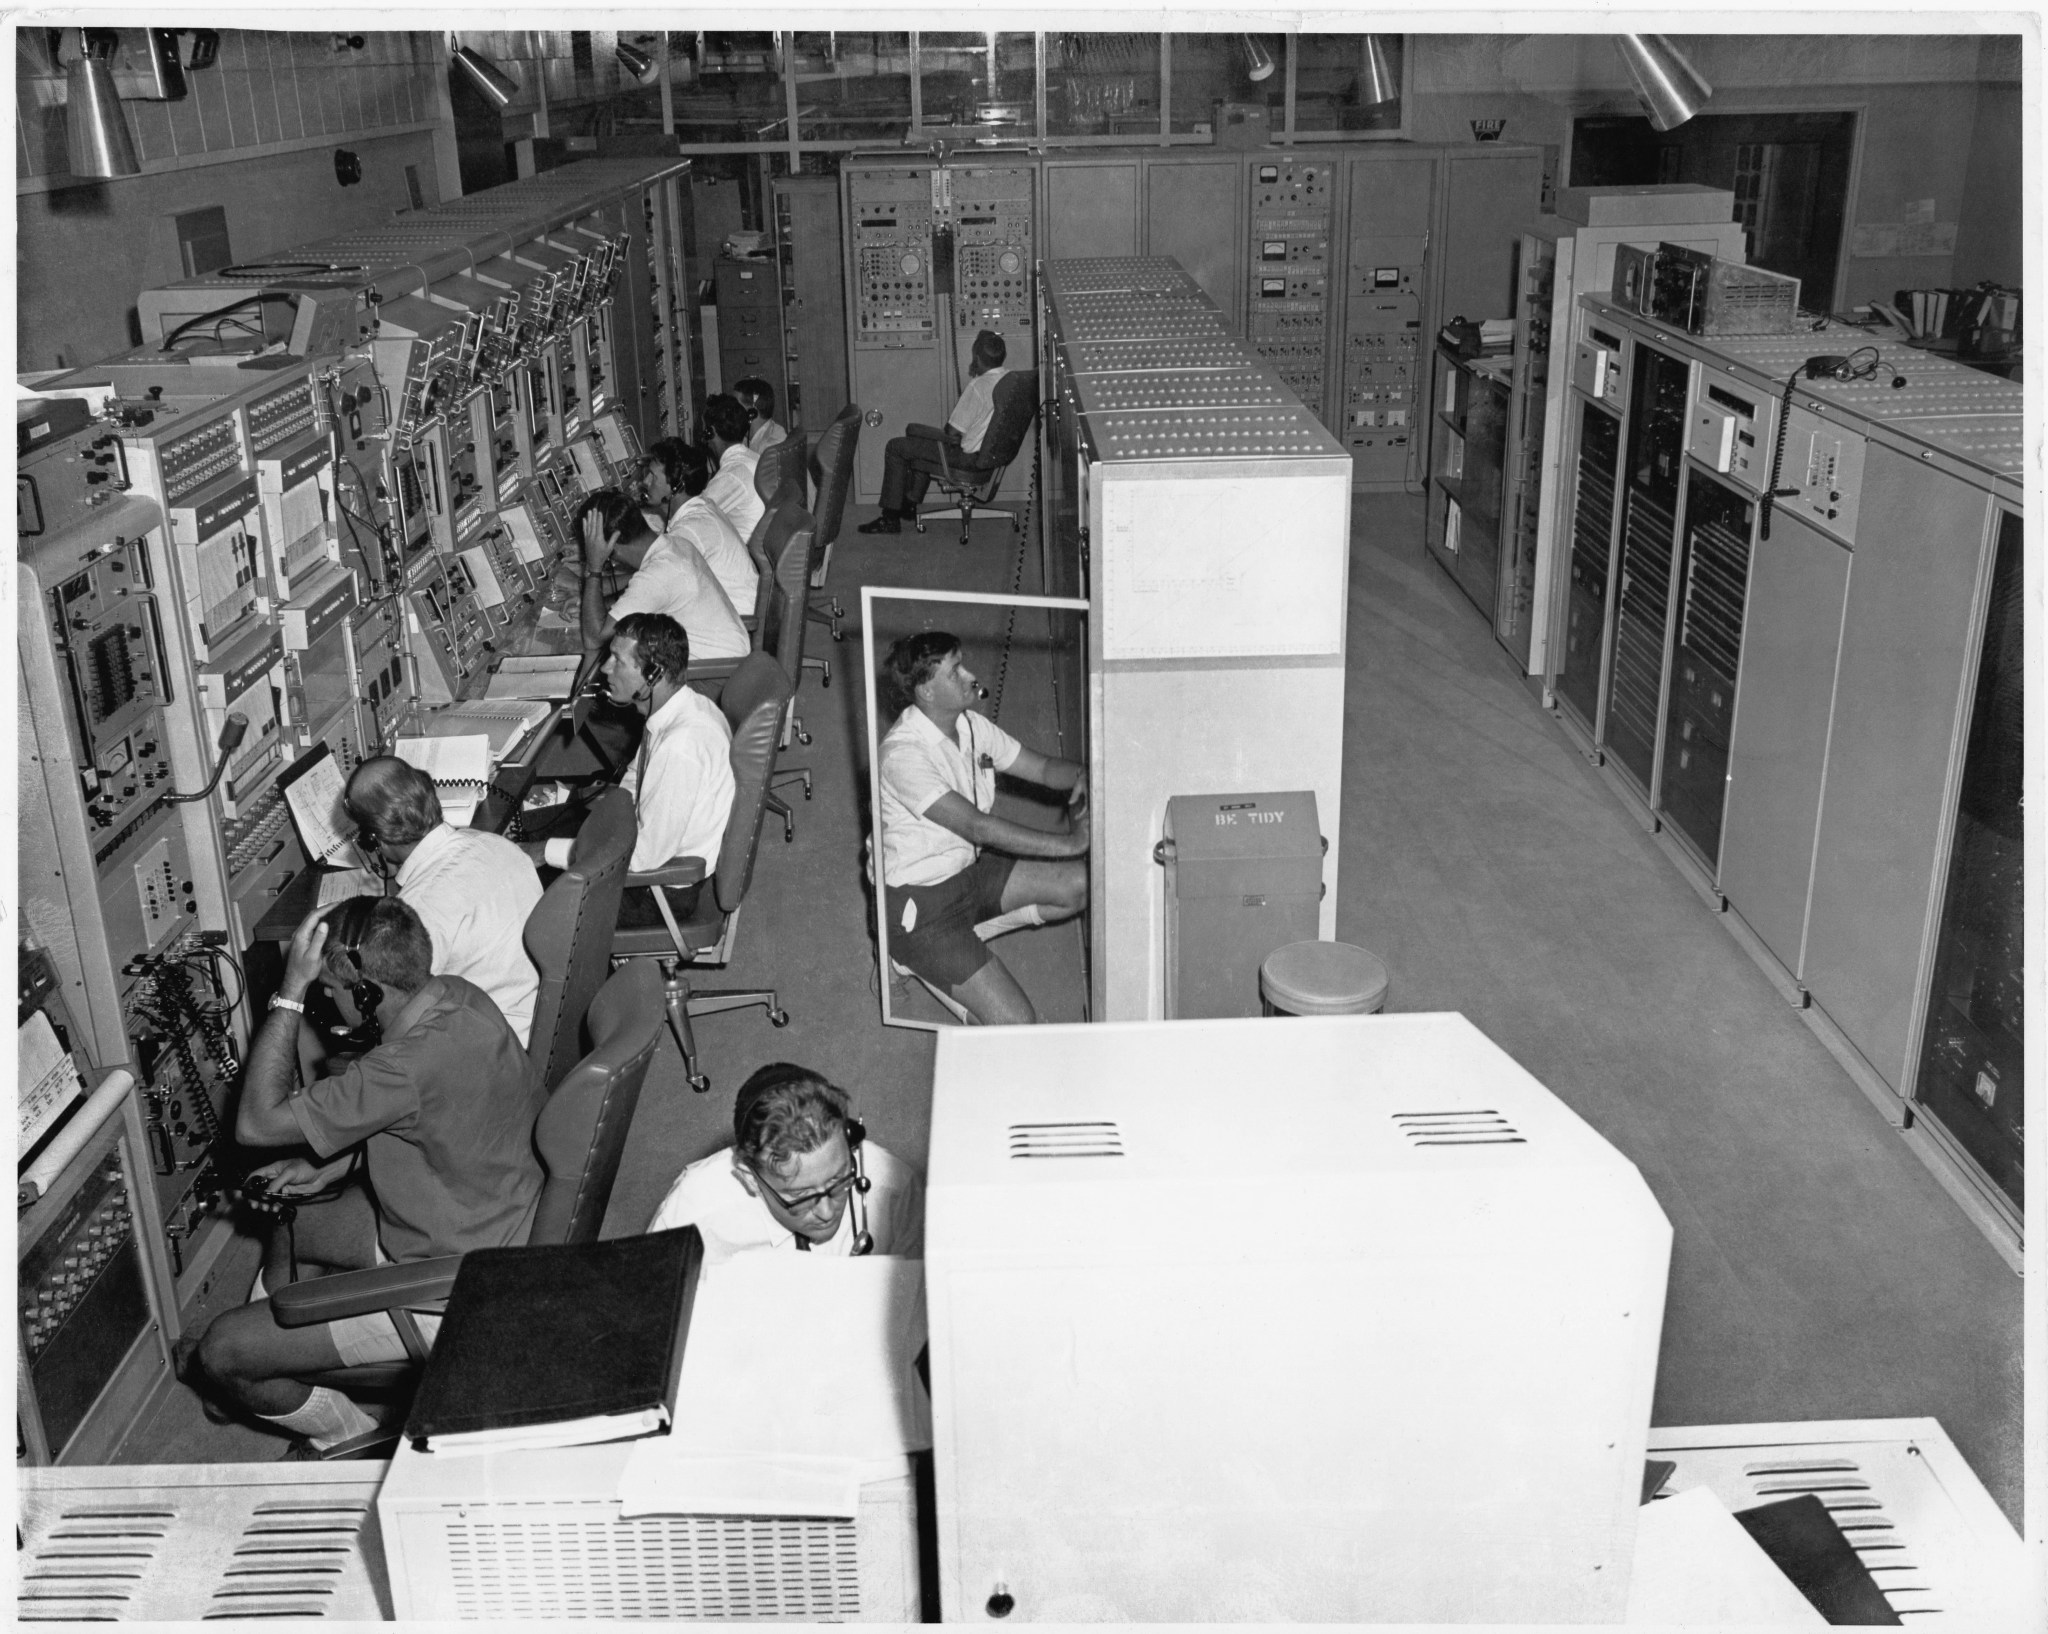
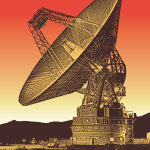
History of the DSN
NASA's Deep Space Network has a long history of enabling exploration. The forerunner to the DSN was established in January 1958, predating the official establishment of NASA in October 1958. On July 20, 1969, Deep Space Network antennas across the world helped receive the first downlink and two-way communication from the surface of the Moon, also receiving the iconic communique, “That’s one small step for [a] man, one giant leap for mankind.”
Learn More about History of the DSN